Current Projects
Bike Comfort Research
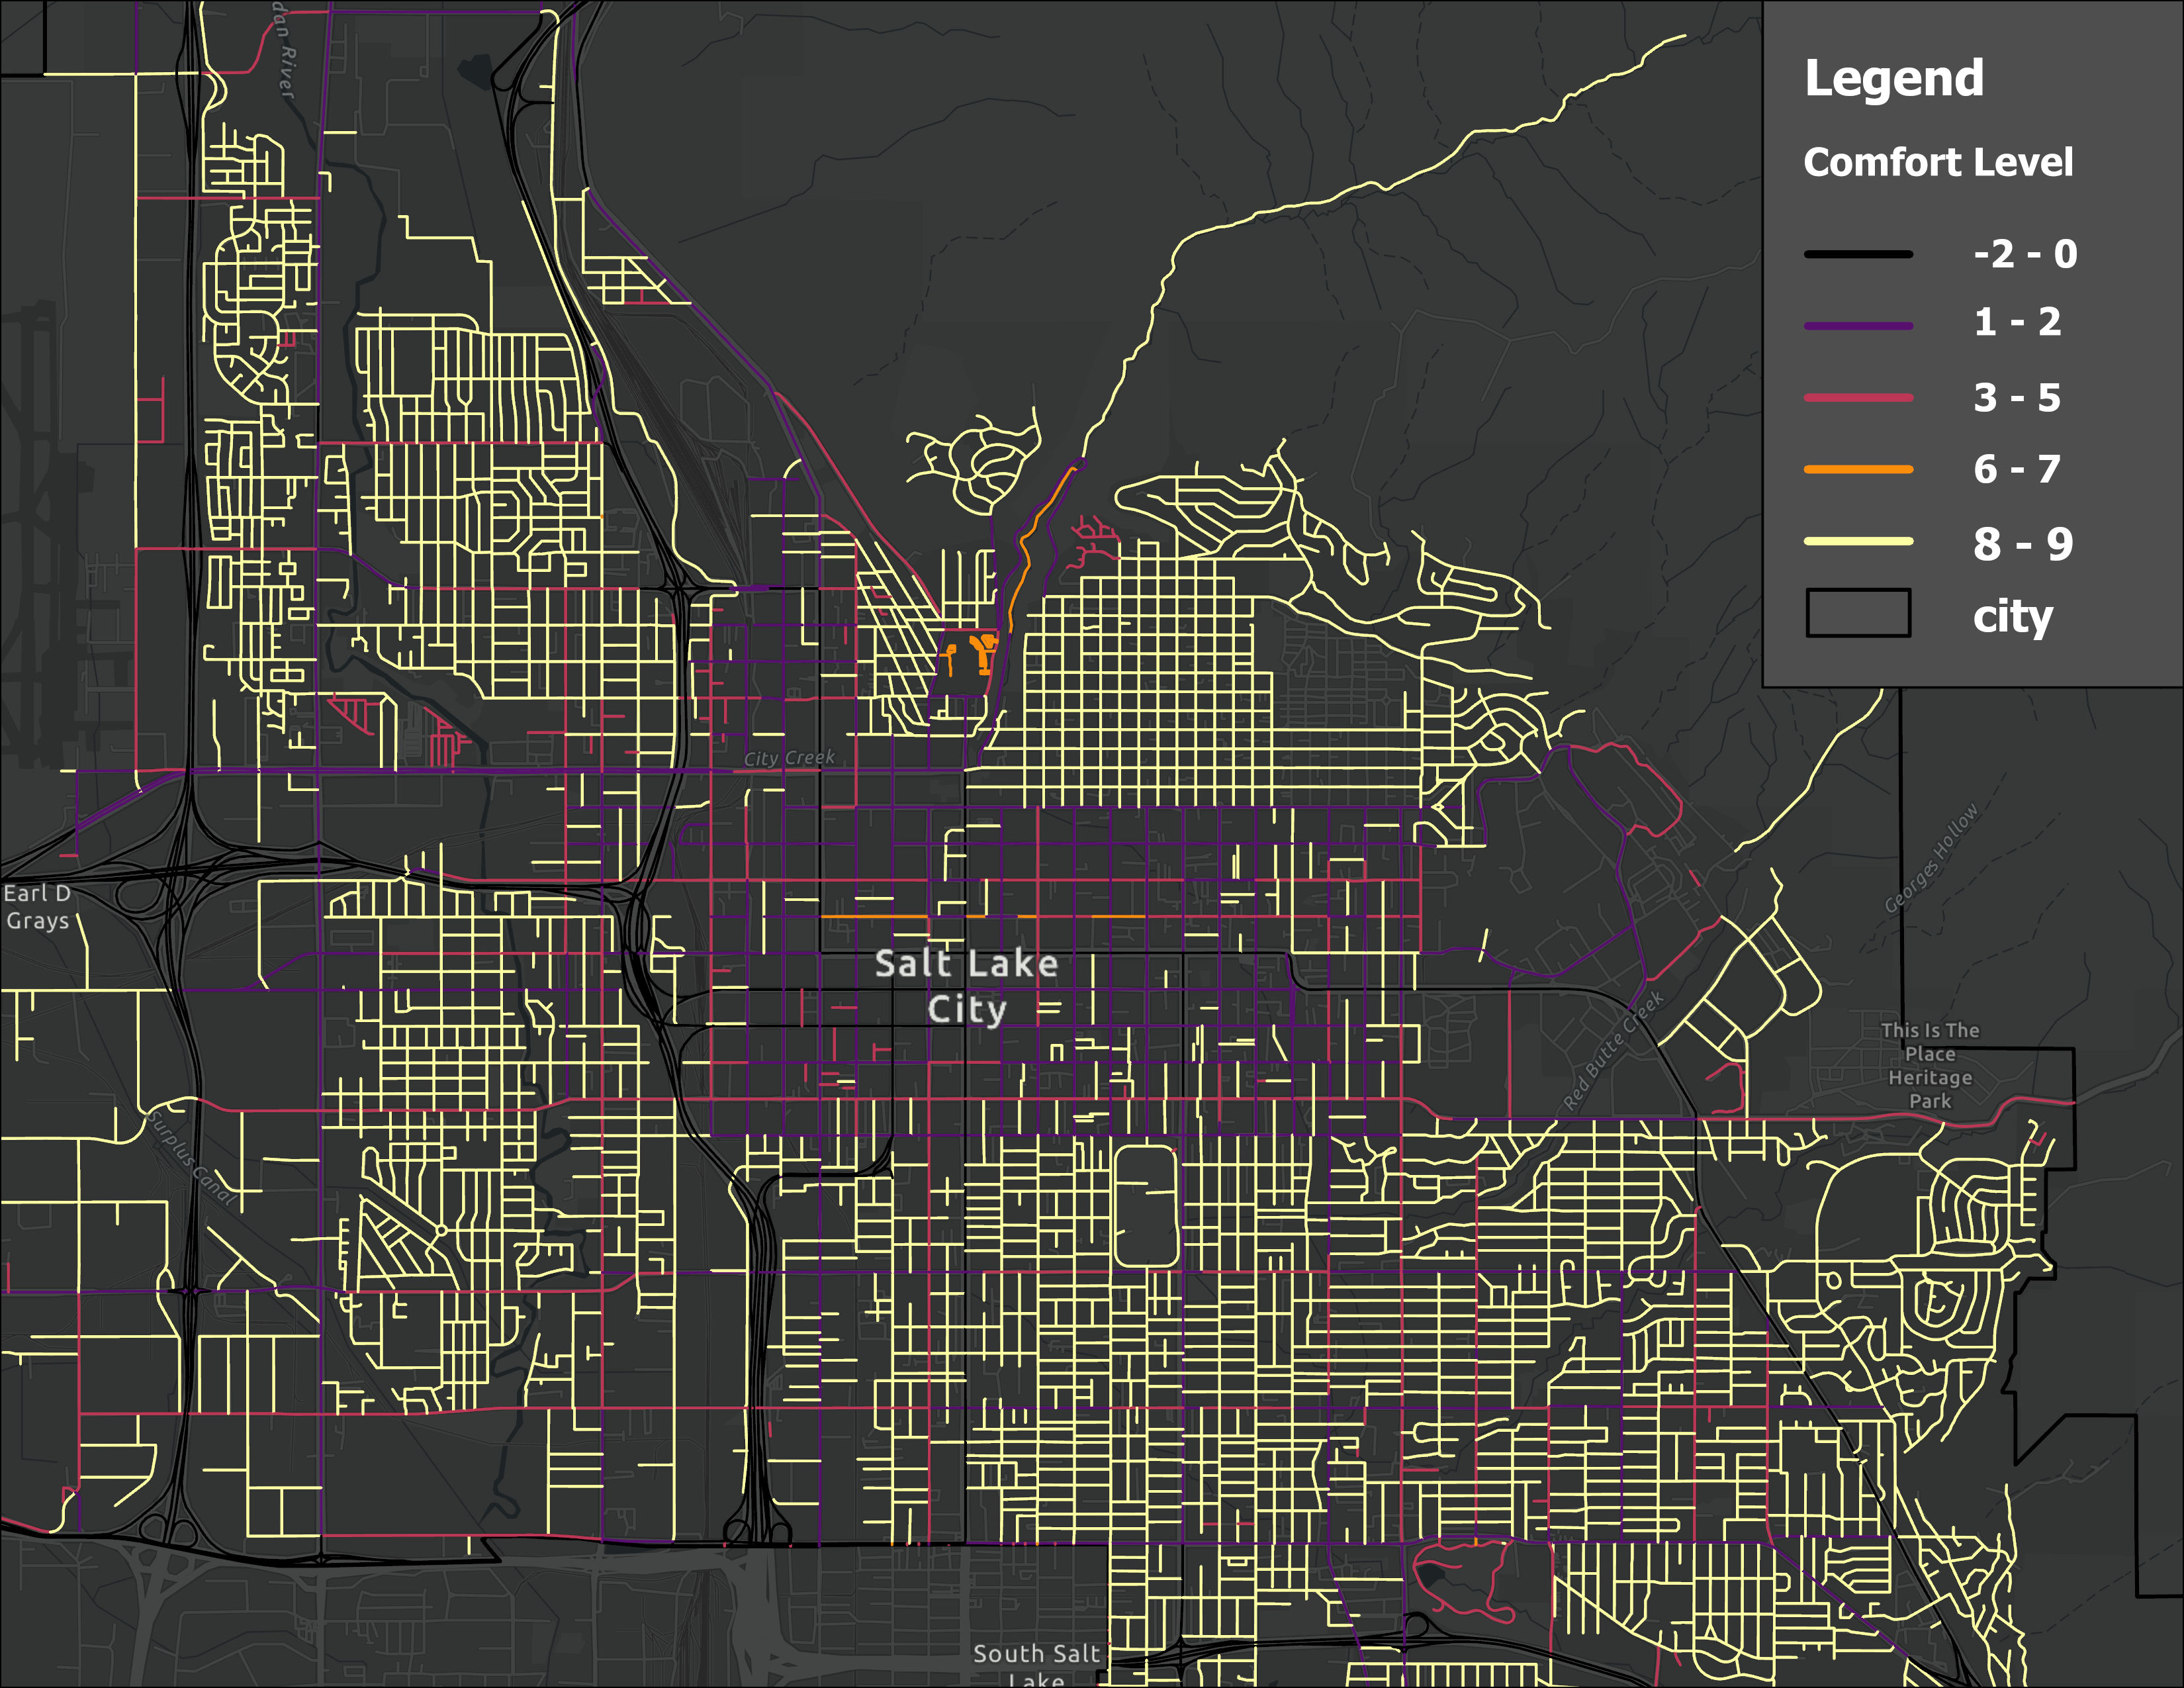
My final project, the Python Coding for GIS class, began as an idea from a friend while talking about the state of cycling infrastructure in Logan. City and County maps had not been updated in years, and an update perpetually seemed around the corner. Taking matters into my own hands, this project involved taking UDOT road data from the UGRC, and creating a “bike comfort” score based on several factors (speed limit, bike lane type, and road ownership). This was only the start, and led to starting a research project to expand the scope of the original tool, with more publicly available data and better score calculations. We are focusing on college towns around Utah, and aim to develop a web tool and app if the analysis beats what is currently available. The web tool will be available on the USU Geospatial website and we will be presenting our research at the UGIC in early May. Below in the drop down is the code from the original tool, and a map of the original output.
Bike Comfort Score Code
            if 1 < speed_limit <= 20:
                comfort_score += 4
            if speed_limit <= 25:
                comfort_score += 3
            if 25 < speed_limit <= 30:
                comfort_score += 2
            if 30 < speed_limit <= 50:
                comfort_score += 1
            if speed_limit > 50:
                comfort_score -= 1
            if speed_limit is None:
                comfort_score += 0

            if bike_right == "2B":
                comfort_score += 1
            if bike_left == "2B":
                comfort_score += 1
            if bike_right == "4B":
                comfort_score += 2
            if bike_left == "4B":
                comfort_score += 2
            if bike_right == "1B":
                comfort_score += 2
            if bike_left == "1B":
                comfort_score += 2

            if dot_fclass == "UDOT":
                comfort_score -= 1
Beaver Dam Censusing
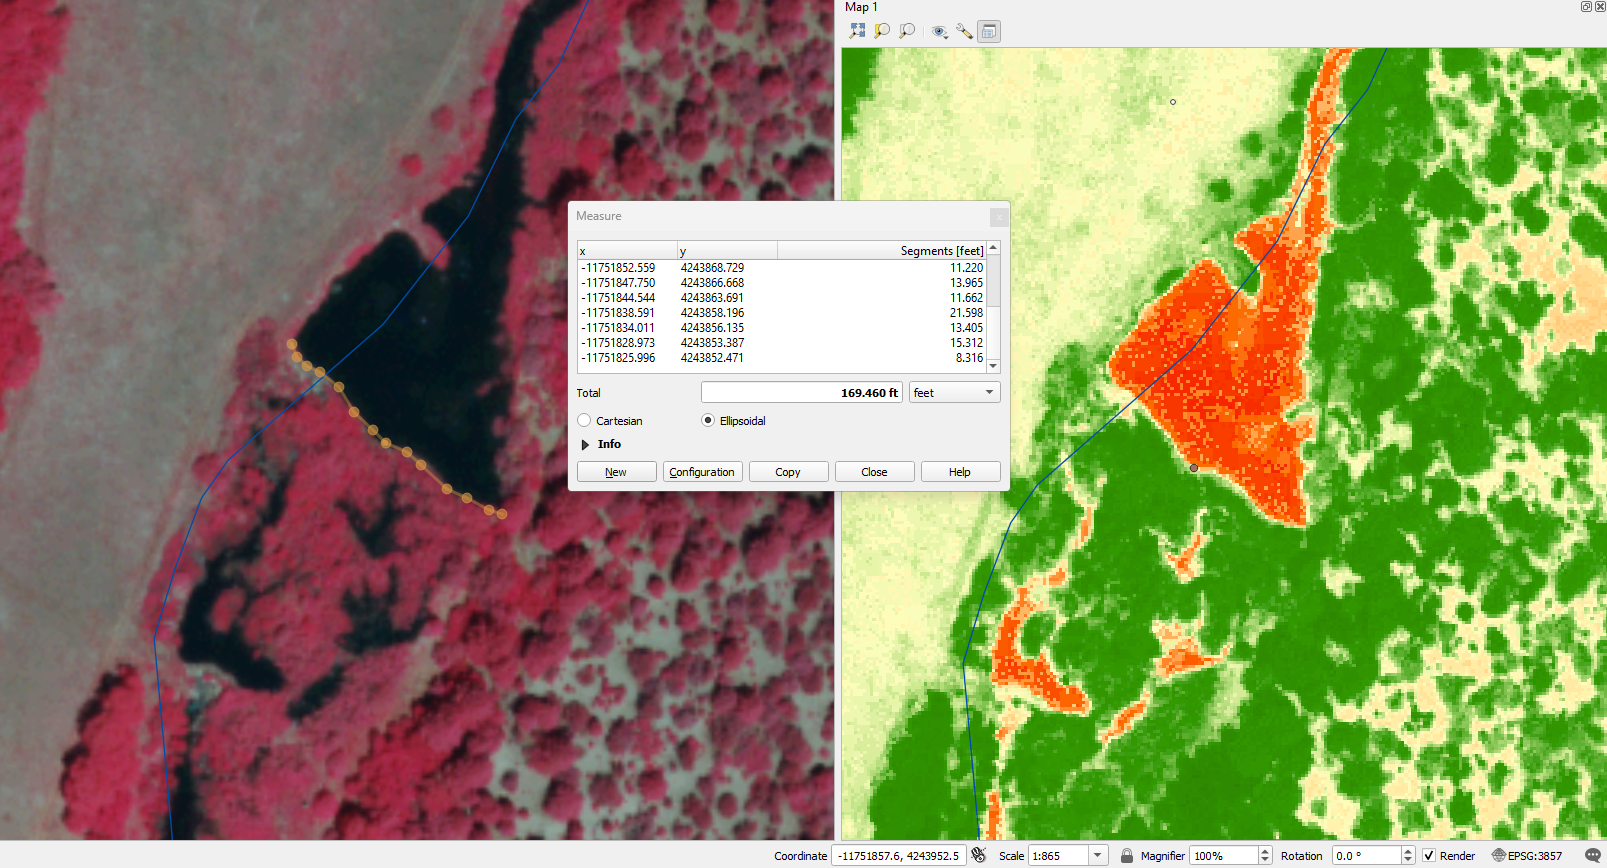
I have been censusing beaver dams in New Mexico the past couple months using NAIP imagery in QGIS. This has been a part of my job in the Riverscape Assessment and Monitoring Lab in the QCNR to help calibrate the Beaver Dam Restoration Assessment Tool. While I am still fairly new to the lab it has been fascinating work. Below is a screenshot of the QGIS window during censusing, showing the NAIP NDVI imagery and False Color being used to better visualize stream depth and water compared to the true color image. More about the censusing protocol can be found here.
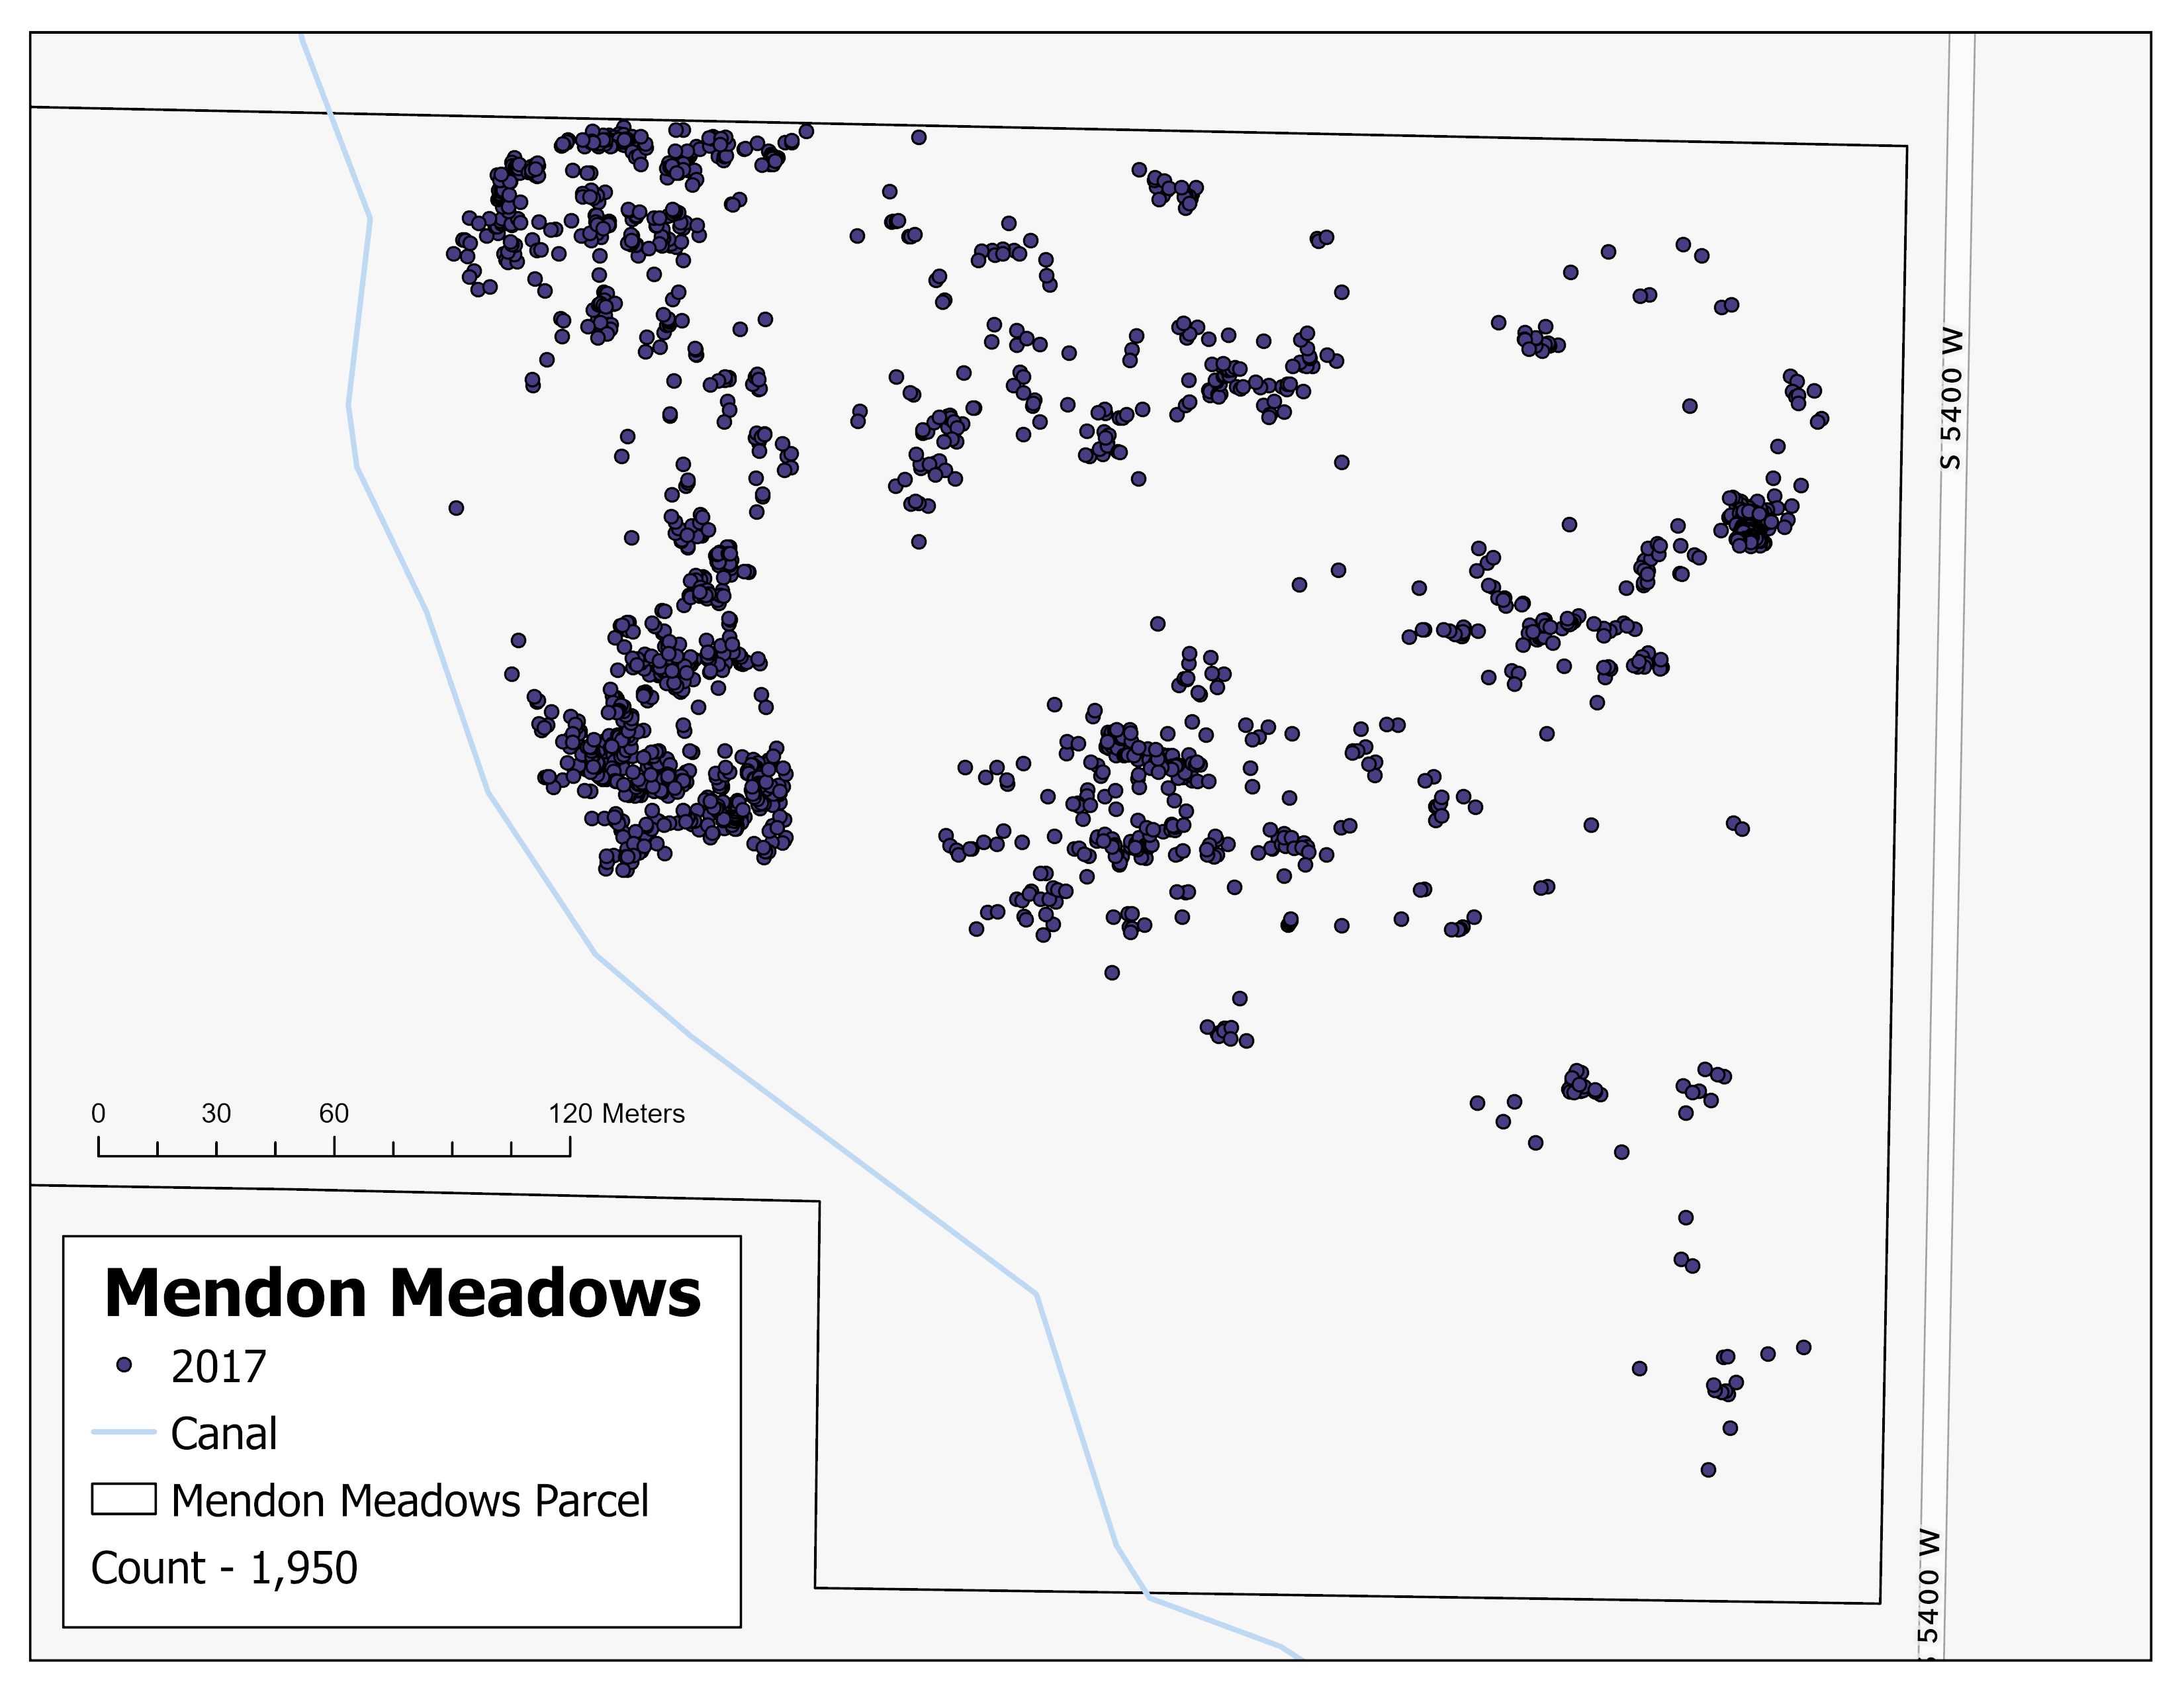
Mendon Meadows Analysis
This project is an attempt to predict future population counts and distributions of Ute Lady’s Tresses (Spiranthes diluvialis) at the Mendon Meadows. The site is currently owned by the Bear River Land Conservancy, and was gifted as a mitigation project for the Ruby Pipeline project. The site is home to the currently threatened species of orchid and the population and distribution has been collected since 2012. Using local weather station data, we are looking to find a correlation between seasonal weather and population counts to better inform conservation efforts. Below is one of a dozen maps created to visualize each year of population counts.